Description
Getting the best data
The Forest Carbon Ratings provide information relevant to the forest and carbon dynamics within a region, down to a second administrative level scale. The product is sold as a bundle of a report in PDF format and the ratings and data insights in CSV format (with provision of an additional shapefile containing insights for the extended licence only). The product is designed for use by public and private industry for forest governance, evaluation for use of forests as stores of carbon for net zero commitments, REDD+, carbon related finance and general forest governance.
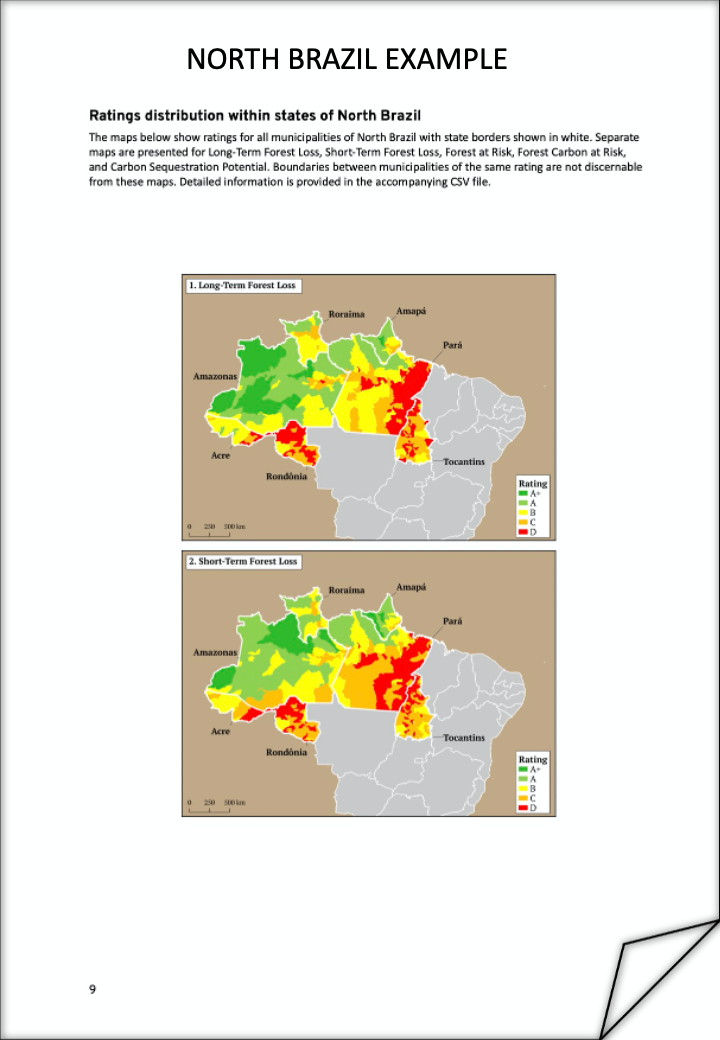
- Long-Term Forest Loss: Denotes the long-term (20 year) historical trend of forest change as a proportion of the baseline forest observed within the area of interest.
- Short-Term Forest Loss: Denotes the forest change within the past year as a proportion of the baseline forest observed within the area of interest.
- Forest at Risk: Denotes the relative risk of forest assets within the area of interest being lost to deforestation.
- Forest Carbon at Risk: Denotes the relative risk to carbon stored in forests that are at high or very high risk of loss due to deforestation.
- Carbon Sequestration Potential: Denotes the potential for carbon to be sequestered through restoration or reforestation efforts on suitable land.
- Forested Area in 2000 (Ha)
- Total Forest Loss 2000 – 2020 (Ha)
- Forested Area in 2019 (Ha)
- 2020 Forest Loss (Ha)
- Proportional Deforestation Risk Score
- Total Forest Carbon at Risk (tC)
- Density of Forest Carbon at Risk (tC/Ha)
- Forest Carbon Density (tC/Ha)
- Total Forest Carbon (Ha)
- Carbon Sequestration Potential (tC)
For external licence purchases, a shapefile of second level administrative boundaries will contain the above information in the attribute fields.
Select a licence that suits your usage
Standard (Internal Use) Licence
A Standard Licence is for internal purposes only. You may not resell or redistribute the Service, or any part of it, outside your organisation or company.
You may use limited extracts of the Service, such as graphs or tables, in a non-systematic manner, for presentation purposes only, provided the source of the information or data is properly cited. See the Terms of Service for more details.
Extended (External Use) Licence
An Extended Licence allows you to use the Service or any part of it to produce your own derived and value-added products for distribution or sale to external organisations, subject to certain requirements.
Limited extracts of the Service, such as graphs or tables, may be used for presentation purposes, provided the source of the information or data is properly cited. See the Terms of Service for more details.
Terms of Service
For full licencing details, see our Terms of Service.
